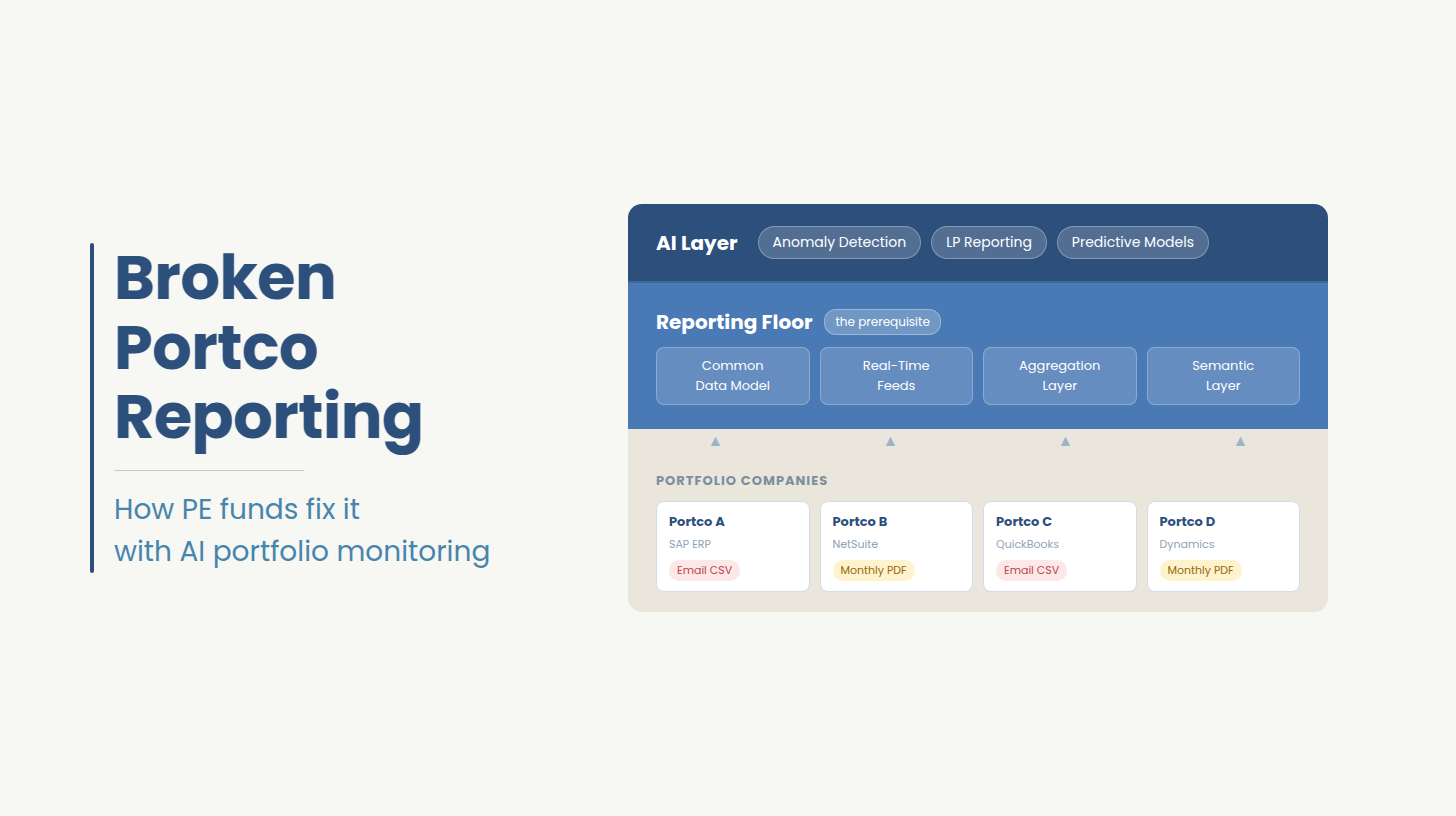
Before evaluating any AI monitoring platform, the first question to answer is what your portcos are sending you: spreadsheets emailed on the last day of the month, PDFs of board decks, and KPI definitions that were never standardized across the portfolio and have not been since acquisition.
The data normalization layer is the prerequisite for it. Without a centralized, automated data layer that enforces standard definitions and replaces the email cycle with live feeds, no monitoring tool, no dashboard, and no anomaly detection engine can tell you what is happening in your portfolio right now.
The business case runs through four pressure points: decision latency, LP confidence, exit valuation, and operational alpha. All four are blocked by the same thing: data that is not fresh, not normalized, and not connected to a system that surfaces it automatically.
Ideas2IT builds this layer as custom software the fund owns outright, normalized ingestion, standardized intake across portcos, live fund-level dashboard, and an AI querying layer for plain English questions against live portfolio data. Consolidated reporting in 45 days. No platform dependency when the engagement end
Most PE funds have invested in AI monitoring tools. Most of those tools are running on top of data that arrives monthly, assembled by hand, structured differently at every portco.
This article is for operating partners who are already past the "should we fix this" question and are trying to figure out how. Here is what it covers:
Why the reporting grind exists and what specifically causes it
What a working solution actually looks like at the engineering level
Why platform subscriptions and internal builds both fall short
How Ideas2IT builds a custom reporting system for PE-backed portfolios that the fund owns outright, with consolidated reporting live in 45 days
If you read nothing else: the fix is a custom-built data layer, inside your environment, that enforces a standard intake format across portcos, automates ingestion, and puts a live AI-queryable dashboard at the fund level. Ideas2IT builds this. The fund owns it when it is done.
The Portfolio Reporting Cycle Inside Most PE Funds
Every operating partner knows this cycle:
The quarter opens and someone sends data request emails to the portco CFOs. Over the next two weeks, responses arrive in whatever format each portco uses: Excel files, PDFs of board decks, a PowerPoint from one company, a password-protected document from another that takes three follow-up emails to open, and one file that does not match the template from last quarter because the portco switched accounting systems in March.
Then the real work begins.
Reconciling EBITDA definitions across portcos where lease treatment was handled differently at acquisition. Re-keying figures from PDFs into the master template. Arguing, again, about what a KPI means across companies that built their own finance functions before the GP acquired them.
A mid-market PE professional described spending 20 to 25 hours per quarter on formal portco reporting, with junior team members closer to 40 to 50 hours. That count does not include weekly calls, follow-up emails, or the time spent explaining to a senior partner why the dashboard does not match what the portco CFO said on the call.
One operating director described it plainly: "You are currently acting as a human interface. Spending expensive hours translating messy operational data into a clean dashboard. The issue is in the ingestion."
By the time the data is clean enough to read, half the quarter is already gone. And next quarter, it starts again from scratch.
The Structural Problems Behind Delayed Portfolio Reporting
Funds assume this is a process problem. And so they get stricter about deadlines, standardize the template or even hire a better associate.
But the data arriving at the fund level is structurally incompatible with automated reporting, and no amount of process discipline changes that. Here is what is causing it.
Definition debt
When a portco is acquired, nobody standardizes every accounting convention on day one. Lease treatment gets classified one way at one portco and differently at another. Revenue recognition varies. EBITDA definitions made sense in context at the time but nobody documented the rationale.
A year later, nobody remembers why it was done that way. The debate restarts at every quarterly close. As one practitioner described it: "You are not debating the metric. You are debating institutional memory."
Every portco built its finance function for its own operations, not to feed a central reporting system. They run different ERPs, different CRMs, different accounting conventions. Forcing ERP convergence post-acquisition costs more than it is worth for a fund on a five to seven year hold. So the fund absorbs the fragmentation manually, every month.
The slowest portco sets the pace for everyone
If nine of ten portcos have automated feeds and one still requires a manual Excel submission, the fund-level report waits for the tenth. ThoughtFocus's 2026 analysis of PE data infrastructure describes this as the lowest common denominator problem: one late or misformatted submission delays the entire cycle. The portfolio runs at the pace of its slowest portco.
The Excel bridge that holds it all together
Disconnected spreadsheets manually joining data from multiple portcos hold the whole thing together and create the most risk. One wrong cell cascades through the TVPI calculation for the entire fund. Most firms discover these errors after the LP report has already gone out.
The combined result: according to V7's 2026 portfolio reporting analysis, 60 to 70% of the reporting cycle at funds that have not systematized this is consumed by data collection and normalization before a single analysis can begin.
The Operational Cost of Delayed Portfolio Data
Here is a scenario that happens at funds across every size and geography.
A portco's gross margin has been compressing for eleven weeks. Not dramatically, just consistently. The kind of trend that, caught early, has three or four intervention options available: pricing adjustment, cost line review, demand mix analysis. The operating partner finds out at the quarterly board meeting. The data had been sitting in a spreadsheet the portco CFO emailed on the last day of the prior month, mapped manually to the fund template, with nothing to flag the pattern.
By the time it surfaces, the intervention window has narrowed to one option: a conversation the operating partner should have had two months ago.
This is what decision latency actually means in practice. It is not an abstract reporting inefficiency. It is the difference between early options and late ones.
The four costs that compound when the data layer is broken:
Cost
What it looks like in practice
Decision latency
Trends surface at board meetings instead of in dashboards. Intervention options have already narrowed by the time the data arrives.
LP confidence
Funds under longer holding periods face LPs who expect visible, data-supported evidence of value creation. Operating partners who cannot show real-time KPI feeds are having a different kind of LP conversation. According to BDO's 2025 PE report, many fund managers still rely primarily on quarterly reports and meetings to assess portco performance.
Exit valuation
Some PE firms now require portcos to submit annual goals and quantified benefits from AI initiatives, per Bain's 2025 Global Private Equity Report. A portco entering a sale process with documented, AI-augmented performance data commands a different multiple than one presenting manual KPI packs.
Operational alpha
Margin compression, pricing anomalies, and cost overruns identified in near-real time instead of at the quarterly board meeting. Without a live data layer, this capability does not exist.
Why Portfolio Monitoring Platforms Alone Do Not Solve the Problem
Most funds that have tried to solve this have taken one of three paths. All three fall short of the same thing.
Buying a platform subscription
These platforms handle dashboards, reporting templates, and fund-level workflow presentation well. They do not handle the normalization engineering that makes those dashboards reliable across a heterogeneous portco stack.
As one PE practitioner described from direct experience: "Out-of-the-box tools are inflexible when it comes to data ingestion and dynamic reporting. You need a custom-built data warehouse that connects to Excel and a BI tool."
A platform subscription solves the presentation layer. The ingestion problem stays exactly where it was.
Internal builds work at one or two portcos where ERP schemas are manageable and the engineering team has bandwidth. They break when ERP heterogeneity compounds across a larger portfolio, when acquired companies arrive with incompatible systems post roll-up, and when the engineers who built the normalization logic leave. The fund ends up owning a brittle, undocumented pipeline that breaks every time a portco changes its chart of accounts. This is a pattern of technology execution risk in private equity that compounds quietly until the damage is already done.
The pattern behind both failures
The platform approach leaves ingestion unsolved. The internal build approach produces something fragile that the next team cannot maintain. Both produce the same outcome: the fund is back to manual reconciliation within 18 months, having spent money on a solution that did not address the root cause.
What neither approach produces is a data layer the fund owns outright, built inside the fund's own environment, that does not require a vendor to maintain or an engineer who has institutional knowledge to not quit.
A $0 Workshop to Map Your Portco Data Infrastructure
A structured private session where Ideas2IT imaps the current data state across your portcos, identifies the normalization and integration gaps in your reporting infrastructure, and outlines the engineering build path to a centralized, AI-ready data layer. Limited spots.
$0
Cost
2 hours
Duration
Private Session
Format
None
Commitment
2–3 days
Board-ready deliverable
What a Centralized Portfolio Data Layer Includes
A centralized portfolio data layer has four components. Each one depends on the layer below it, so the sequence matters.
Layer 1: ERP normalization
Each portco runs its own system: SAP, NetSuite, QuickBooks, Dynamics, or a vertical-specific ERP. Each has its own chart of accounts, KPI definitions, and reporting cadence. The normalization layer maps all of these to a shared taxonomy without requiring changes to the portco's source systems.
Revenue means the same thing across every portco. EBITDA is calculated the same way. The debate about definitions happens once, during build, and is locked in the data model.
Layer 2: Standardized intake, enforced
The normalization layer needs data to normalize. The intake format is standardized and non-negotiable across portcos, enforced on a fixed timeline. Every portco feeds into the same format. The format is standardized. The portco's source system is not touched.
This is what replaces the email cycle. Not a request that goes out and comes back in eight different formats. A system that collects the right data from the right place on the right schedule.
Layer 3: Portfolio-level aggregation
With normalized, regularly-ingested data in a central store, the aggregation layer produces fund-level views: revenue across portcos, margin trends by sector, churn by cohort. It preserves portco-level granularity so the operating partner can drill from fund view to company view in the same interface.
Roll-up logic that works for three portcos breaks at fifteen without deliberate data architecture at this layer.
Layer 4: AI-queryable dashboard
At the top sits the capability most operating partners want but cannot get to because the three layers below it are missing. A live dashboard with near-real-time data. An AI querying layer that answers questions in plain English: "Which portco has the widest EBITDA variance from plan this quarter?" "Which three companies have the fastest-deteriorating gross margin trends?" No reporting queue and no waiting for a dashboard that was built for last quarter's question.
How Ideas2IT Builds Portfolio Data Infrastructure for PE Funds
Most funds that come to Ideas2IT have already tried one of the approaches described above. They bought a platform that left the ingestion problem unsolved. Or they built something internally that broke when the team changed. They are not looking for another vendor to manage. They are looking for something they can own and operate themselves.
That is specifically what Ideas2IT builds.
The engagement produces software the fund owns outright: a normalized ingestion system with a standardized intake format enforced across portcos, a central data store with automated feeds from portco operational systems, a fund-level dashboard with real-time data, and an AI querying layer for plain English questions against live portfolio data.
What the fund receives at the end of the engagement:
Deliverable
What it produces
Normalized ingestion system
Each portco's ERP schema mapped to a shared taxonomy. Definitions locked in the data model, not in an email thread.
Standardized intake enforcement
Fixed-timeline intake format across every portco. The monthly email cycle replaced by an automated pull.
Central data store
Automated feeds from portco operational systems. Live or near-live data at the fund level.
Fund-level dashboard
Real-time portfolio view with drill-down to portco level in one interface.
AI querying layer
Plain English questions against live data. No reporting queue, no analyst bottleneck between the question and the answer.
No platform dependency. No licensing cost tied to the data layer. No vendor to call when a portco changes its ERP or a new acquisition joins the portfolio.
How the build gets done
Ideas2IT engineers embed inside the portco's existing environment from day one. They work within the existing stack, attend the standups, and operate against the same OKRs as the portco's internal team. This is not a specification-handoff engagement. The engineer normalizing and connecting that data is inside the system that data lives in. That is why the builds hold up after the engagement ends: the documentation reflects what the system is, not what someone assumed it was from the outside.
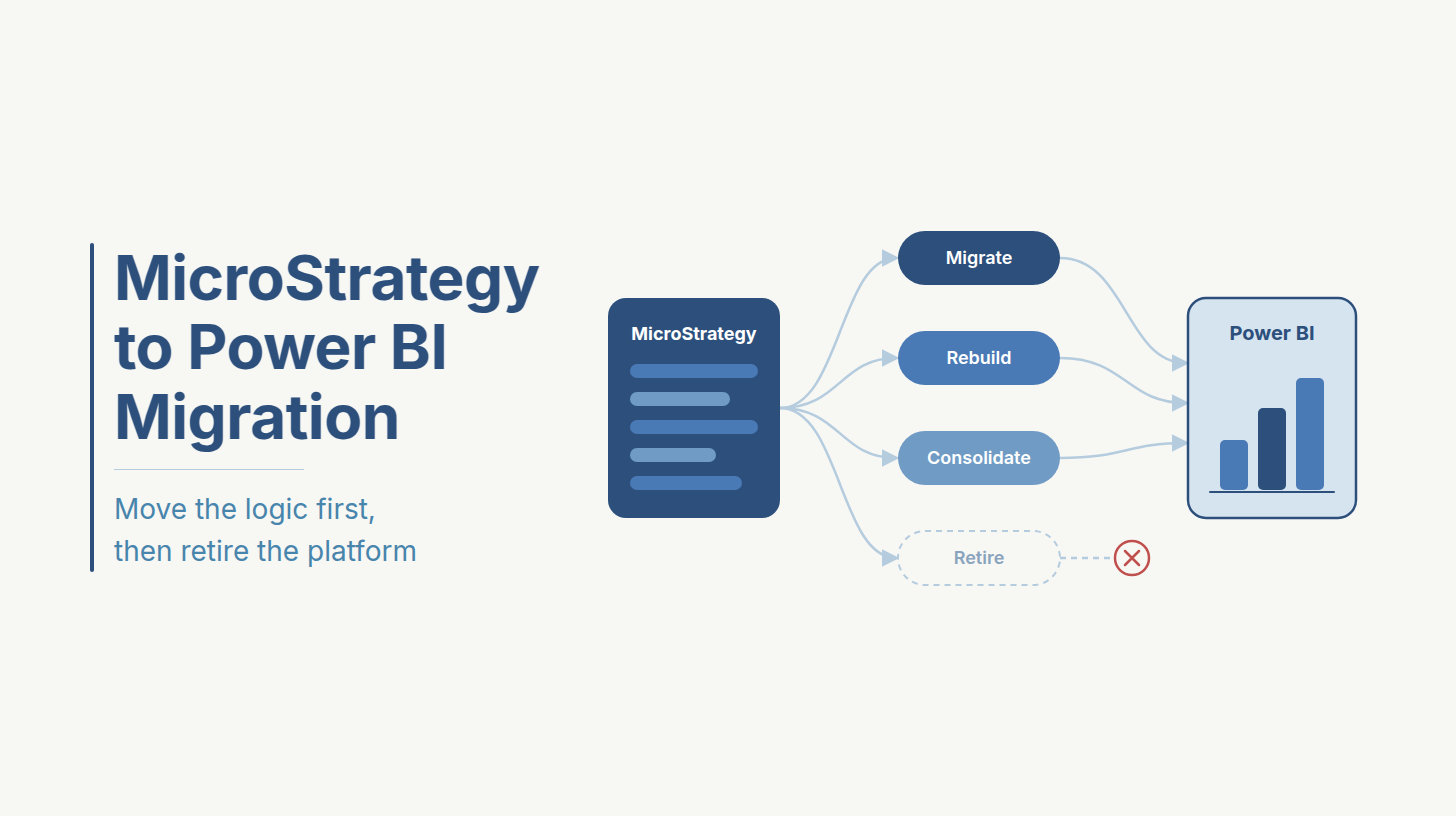
For portfolios where the build involves consolidating data across portco systems after an acquisition or roll-up, Ideas2IT's MigratiX platform automates schema analysis, transformation code generation, validation, and data loading. Migrations that would take several months to execute manually complete 80% faster. Portcos keep their existing systems.
The natural language querying layer is built on Ideas2IT's conversational BI work through DataStoryHub. It works because the semantic model underneath it is built to PE-specific constructs: EBITDA by portco, revenue by segment, debt service coverage, churn by cohort. Generic BI definitions do not answer PE operating questions. This one does.
Ideas2IT holds SOC 2 Type II and ISO 27001 certifications and is an AWS GenAI Specialist Partner. For portfolios requiring air-gapped or private cloud deployment, that option is available within the same delivery model.
Where to Start
Ideas2IT has consolidated portco reporting in 45 days for PE-backed portfolios. The starting point is a free Data Modernization Assessment.
Here is what it involves and what it produces:
What you bring: Your portco list, the ERPs and accounting systems each one runs, and your current reporting setup (even if that setup is "CFO emails a spreadsheet every month").
What happens in two weeks: Ideas2IT maps the current data state across your portcos, identifies the normalization and integration gaps in your reporting infrastructure, and builds a sequenced engineering plan with cost estimates specific to your portco stack.
What you walk away with: A prioritized build plan you own and can use regardless of what you decide to do next. Not a pitch deck. A working document.
There is no commitment required to get the assessment. If the build plan is useful and you want Ideas2IT to execute it, that conversation happens after.
If you want to see what the build looks like for a fund your size, that is exactly what the assessment produces.
For PE operating partners ready to move from fragmented portco reporting to a centralized, AI-ready data layer, a scoped working session with Ideas2IT produces a concrete architecture assessment and a delivery plan.
How do PE firms use AI to monitor portfolio company performance?
AI portfolio monitoring pulls real-time operational data from portco systems into a centralized layer, then applies anomaly detection, predictive analytics, and automated reporting on top of it. The monitoring tools flag KPI deviations as they occur rather than six weeks later. The prerequisite is the Reporting Floor, a normalized, real-time data infrastructure that most portfolios still need to build.
What is the Reporting Floor in private equity AI?
The Reporting Floor is the minimum normalized, real-time data infrastructure a PE portfolio requires before any AI monitoring tool or reporting engine can produce reliable output. It consists of four components: a common data model across portco ERPs, real-time data feeds from portco systems, a portfolio-level aggregation model, and a semantic layer for AI-readable output.
Should PE firms build, buy, or partner to build AI data infrastructure?
Platform subscriptions solve the presentation layer but not the normalization engineering underneath it. Internal builds work at small scale but break as ERP heterogeneity compounds. An embedded engineering partner builds the normalization layer, real-time feeds, and semantic layer inside the portco's existing stack without system replacement and the client owns the output.
How do PE firms normalize data across portcos with different ERPs?
Normalizing portco data across different ERPs requires building a transformation layer that maps each portco's source schema to a common taxonomy. The process involves schema analysis, transformation logic, and validation rules for each source system. Modern approaches handle this without requiring changes to underlying portco systems. Complexity scales with portfolio heterogeneity.
What is the difference between a centralized and decentralized AI operating model in PE?
In a decentralized model, each portco manages its own AI tools with no shared data layer where the GP has no portfolio-level view. In a centralized model, the fund builds shared data infrastructure and AI sits on top of it.
How long does it take to build AI data infrastructure for a PE portfolio?
A complete Reporting Floor build typically takes three to six months depending on portfolio size and ERP heterogeneity, with data normalization as the longest phase. A portfolio of five portcos on two ERPs has a shorter path than a buy-and-build platform across fifteen portcos and six systems.