

Overview
Unrecognized precursors could lead to preventable mortality and morbidity, apart from the extra costs that the patients would have to pay. The majority of mortality rates are associated with patients who require an unplanned transfer to the ICU. Few studies report that the mortality rates in these circumstances could be above 50%. Determining clinical deterioration in patients can help identify risk associated with each of them and hence could act as a warning system to prevent mortality in certain cases.Apart from reducing mortality rates, such an automation process could also help in campaign management and could be very useful from an insurance perspective. Owing to all these factors, automated identification of clinical deterioration has become highly pertinent. Several studies have been reported on identifying the risk associated with patients, and some of these have been frequently used to predict the mortality rate in patients, length of stay, readmission, etc.Readmission prediction is imperative for the fact that Healthcare treatments in the US are expensive and predicting ICU Readmission well in advance helps improve patient care and also helps in improving hospital operational efficiency. The Agency for Healthcare Research and Quality (AHRQ), after an exclusive study on readmission, concluded that the average cost for any diagnosis in 2016 was approximately $14,400 and this figure is quite likely to significantly increase in the near future. Patients’ EHR data can be used by robust machine learning models to identify subtle patterns and potentially create an early warning system for clinicians so they can intervene before the ICU transfer/readmission is needed.
Objective
- Develop machine learning models that can predict unplanned ICU readmission based on EHR records.
- Identify features that could be used to commonly identify patient risk.
Approach
Data Source
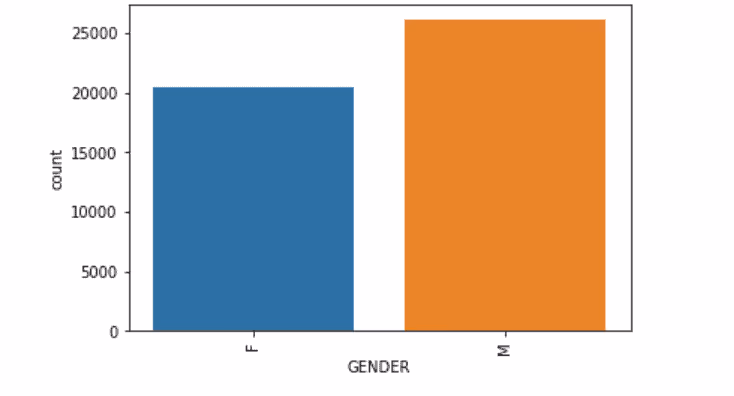
The Dataset used for this study was sourced from the MIMIC database. MIMIC III dataset is an open-source dataset that basically has patients' EHR from 6 different ICUs collected over a period of many years. The dataset has information on 61532 ICU stays, 53432 adults and 8100 newborns. The data was prepared in a way that the following tables were merged into a single union of truth: Admissions, ICUStays, Admission, Diagnoses, Procedures. The Gender Ratio of Male:Female was found to be 56:44. The mean age of the patients was 61.96 ± 16.47 years. The variables that were present in the tables were Admission Type, Admission Location, Admit Time, Discharge Time, Marital Status, Ethnicity, Diagnosis, Procedures
Labeling the Data
A lag variable of ICU Admit Time was created and the time taken between two admission dates were calculated. If the Admit Times were less than 30 days for a patient, then a readmission flag was labeled. The data was considered only for adults and only unplanned emergencies were considered for the ICU Readmission Prediction.
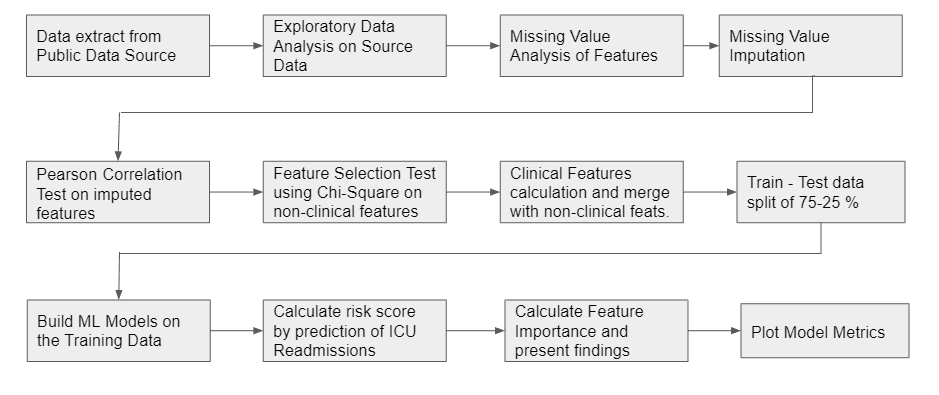
Exploratory Data Analysis on the Source
Output Label
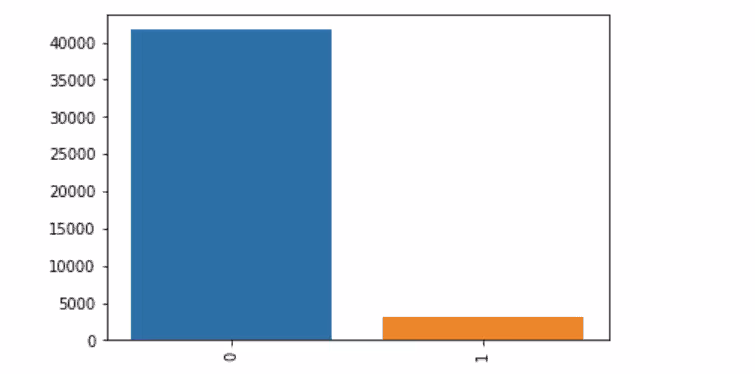
Age
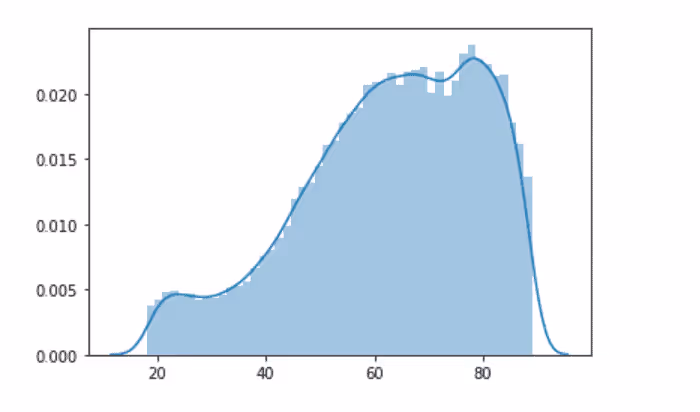
Length of Stay
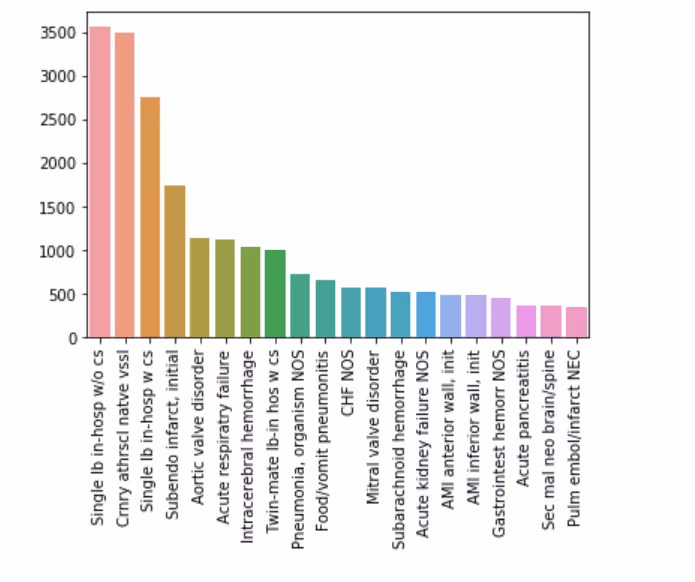
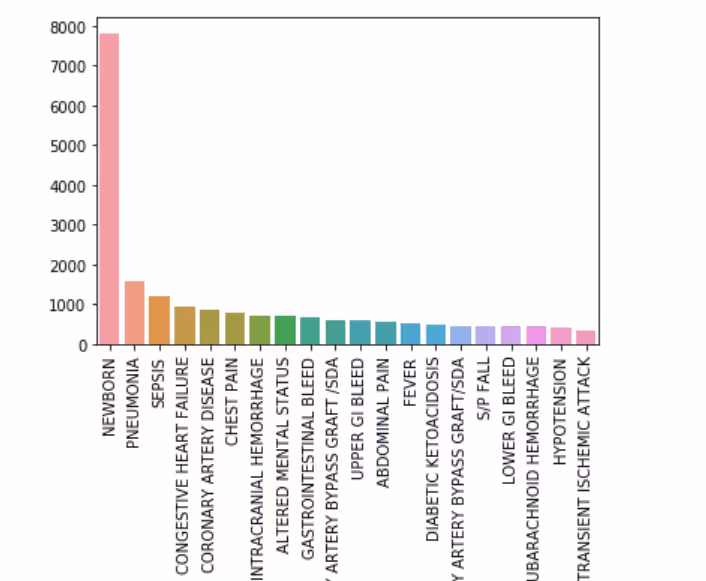
Top 20 Primary Diagnosis
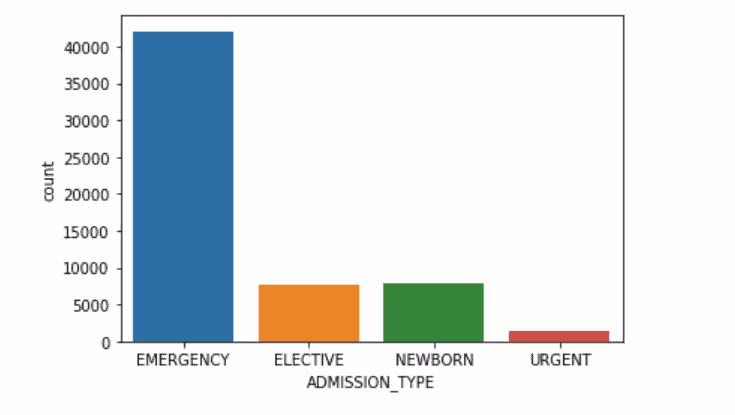
Admission Type
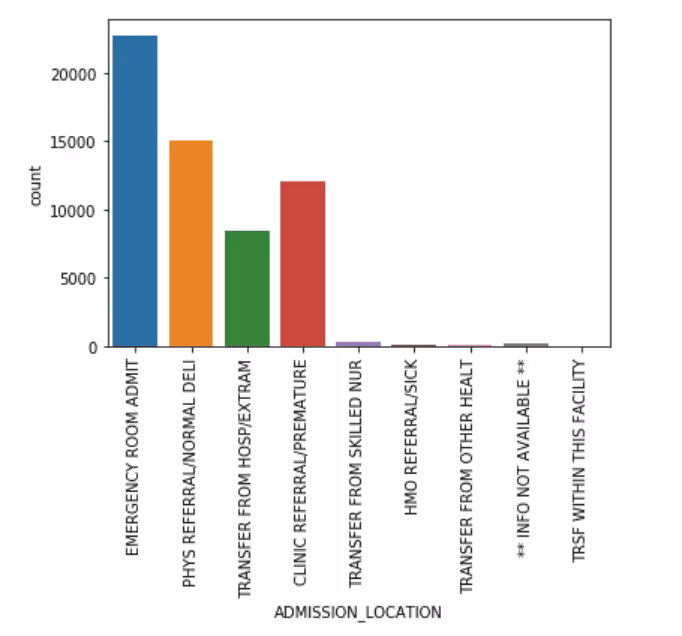
Admission Location
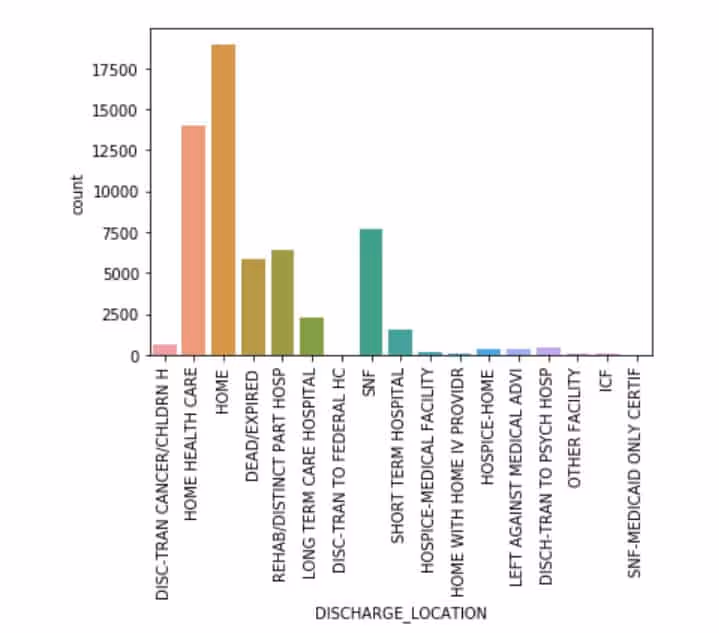
Discharge Location
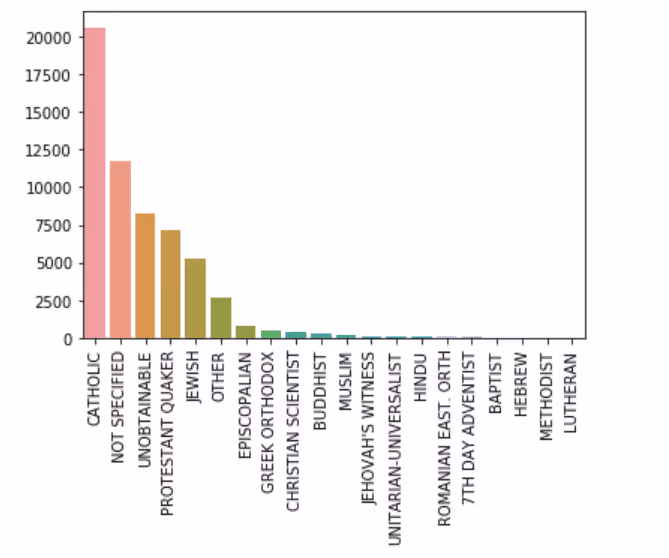
Religion
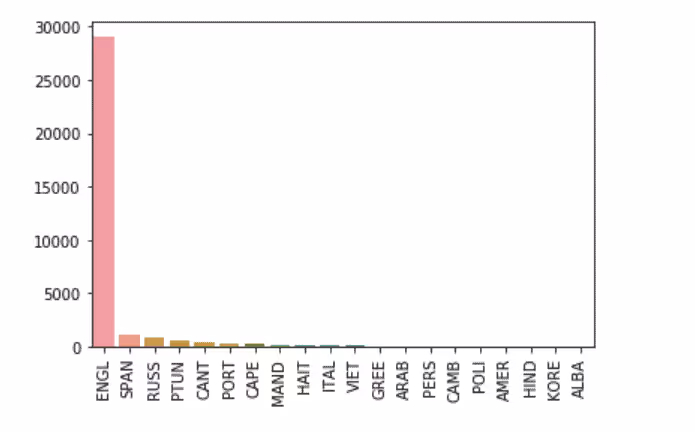
Top 20 Languages Spoken By Patients
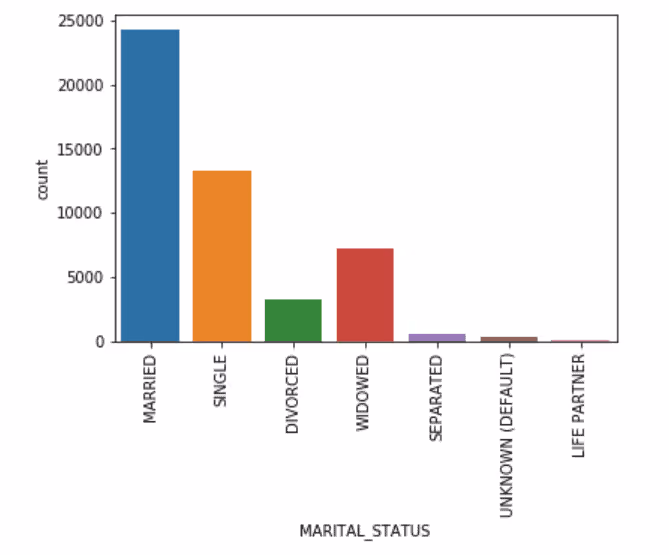
Marital Status
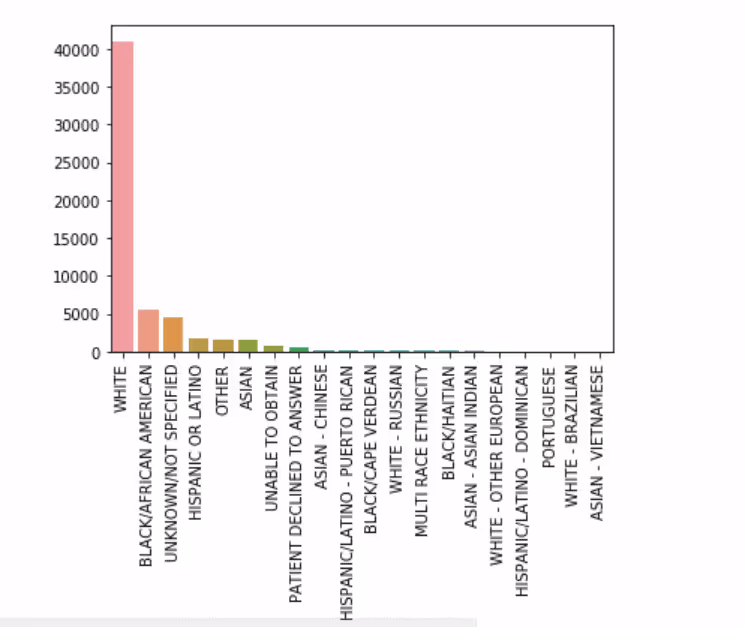
Ethnicity
Top 20 Diagnoses
<b.Gender
Clinical Features Computation
Patients’ parameters were present in the chart events table, which basically talks about vital signs and other body parameters measured at a regular interval of time. These time-related measurements were used in the current study to determine the risk associated with each patient at various intervals of time. Clinical research papers report risk scores such as LACE (Length of Stay, Acuity of Admission, Charlson Comorbidity Score, Emergency Score), SIRS (Systemic Inflammatory Response Score), SOFA (Sequential Organ Failure Assessment Score), qSOFA (Quick Sequential Organ Failure Assessment Score), SAPS II (Simplified Acute Physiology Score II), Elixhauser Score as being significantly related to predicting mortality, length stay and readmission. Therefore the current study has used the above scores to compute the risk score associated with each patient at different time intervals. Subsequently, these clinical features were computed for every patient’s ICU stay and the data was aggregated on a Patient ID, Admission ID and ICU Stay ID basis and measures like the clinical feature’s min, max, mean, standard deviation, skewness , 5th Percentile and 95th percentile were computed.
Modeling
The clinical features and patient demographics were merged to form a flat-file. The sample data was split into training and testing dataset of 75% - 25% . Since the dependent variable had a Yes:No ratio of 6:94, the dataset is a highly imbalanced one. Hence the dataset was balanced to get an equal ratio of Yes-No in the training dataset. A Master Model with a combination of the clinical and non-clinical features was built with Random Forest of 100 Trees.
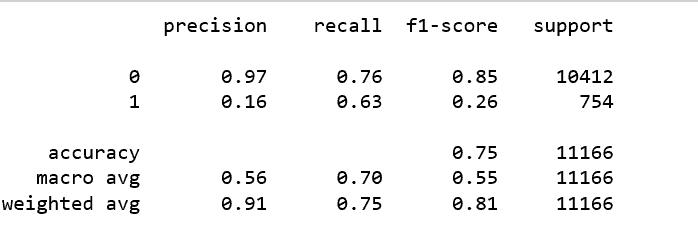
ML Results of the Master Model
Classification Report
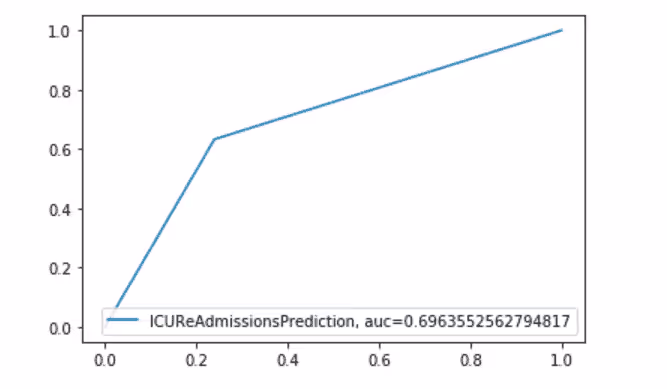
AUC Curve
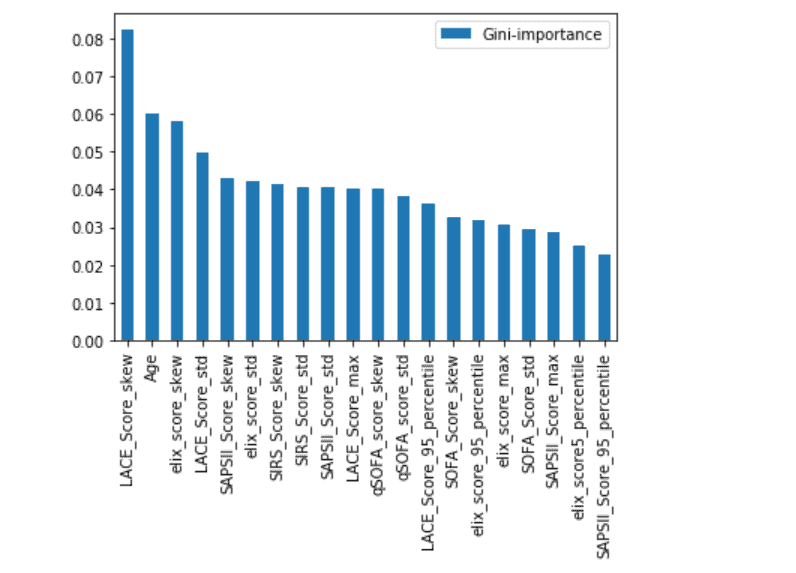
Feature Importance Plot
Conclusion
The sample used for the study was limited to adults' unplanned ICU visits. The random forest model was able to predict ICU readmission with a balance accuracy score of 75%. Models were built on each risk score, however, those models yielded a lesser accuracy. LACE, AGE, and Elixhauser scores seem to be more important than the other scores for the input sample. However, it must be noted that some of the measurements were missing in chart events, and some of the measurements were taken at different time intervals, thus creating a discrepancy in the scores computed at that time. This might be a reason for lower accuracy.About Ideas2IT,Are you looking to build a great product or service? Do you foresee technical challenges? If you answered yes to the above questions, then you must talk to us. We are a world-class custom .NET development company. We take up projects that are in our area of expertise. We know what we are good at and more importantly what we are not. We carefully choose projects where we strongly believe that we can add value. And not just in engineering but also in terms of how well we understand the domain. Book a free consultation with us today. Let’s work together.To know more, talk2us@ideas2it.com or visit www.ideas2it.com


.png)


.avif)
.avif)

.avif)


%20Top%20AI%20Agent%20Frameworks%20for%20Autonomous%20Workflows.avif)


%20Understanding%20the%20Role%20of%20Agentic%20AI%20in%20Healthcare.png)
%20AI%20in%20Software%20Development_%20Engineering%20Intelligence%20into%20the%20SDLC.png)
%20AI%27s%20Role%20in%20Enhancing%20Quality%20Assurance%20in%20Software%20Testing.png)

.png)


%20Tableau%20vs.%20Power%20BI_%20Which%20BI%20Tool%20is%20Best%20for%20You_.avif)
%20AI%20in%20Data%20Quality_%20Cleansing%2C%20Anomaly%20Detection%20%26%20Lineage.avif)
%20Key%20Metrics%20%26%20ROI%20Tips%20To%20Measure%20Success%20in%20Modernization%20Efforts.avif)
%20Hybrid%20Cloud%20Strategies%20for%20Modernizing%20Legacy%20Applications.avif)
%20Harnessing%20Kubernetes%20for%20App%20Modernization%20and%20Business%20Impact.avif)
%20Monolith%20to%20Microservices_%20A%20CTO_s%20Decision-Making%20Guide.avif)
%20Application%20Containerization_%20How%20To%20Streamline%20Your%20Development.avif)
%20ChatDB_%20Transforming%20How%20You%20Interact%20with%20Enterprise%20Data.avif)
%20Catalyzing%20Next-Gen%20Drug%20Discovery%20with%20Artificial%20Intelligence.avif)
%20AI%20Agents_%20Digital%20Workforce%2C%20Reimagined.avif)
%20How%20Generative%20AI%20Is%20Revolutionizing%20Customer%20Experience.avif)
%20Leading%20LLM%20Models%20Comparison_%20What%E2%80%99s%20the%20Best%20Choice%20for%20You_.avif)
%20Generative%20AI%20Strategy_%20A%20Blueprint%20for%20Business%20Success.avif)
%20Mastering%20LLM%20Optimization_%20Key%20Strategies%20for%20Enhanced%20Performance%20and%20Efficiency.avif)

.avif)


.avif)


.avif)


.avif)


